Finding out slowest tests of your PHPUnit test suite
Writing tests is a very important and tranquilizing task in developer daily life. Delivering a new feature with green tests removes so much stress, telling the developer he had not break anything. That’s why you should write tests for every single new piece of code you implement.
If you joined a big project, you should have noticed that tests are very slow to execute. For instance, on a current huge project we have at Marmelab, tests are taking 45 minutes. This is generally not an issue with continuous integration server, as you can execute tests in background without monopolizing your workstation. Yet, long tests are really a bad point when you are in a matter of urgency.
Let’s consider this (sadly) common situation where you just released a new version in production and when your customer calls you completely panicked to warn you about a critical bug. Fix may be quick, deployment may also be if you decide to bypass tests. Yet, this is so much stressful and dangerous: you do not have any net and may break something else with your fix. That’s why reducing tests duration is really important.
But the first step to achieve such a purpose is to visualize which tests are the slowest, to focus efforts on it. That’s why I created PHPUnit d3 report.
PHPUnit debugging report
Before reinventing the wheel, I took a look to check if any tool already existed. First, I naively tried to use the debug option of PHPUnit. But it gave me only the overall duration of the whole test suite:
PHPUnit 3.7.28 by Sebastian Bergmann.

Configuration read from /home/jpetitcolas/dev/Faker/phpunit.xml.dist

Starting test 'Faker\Test\GeneratorTest::testAddProviderGivesPriorityToNewlyAddedProvider'.
.
Starting test 'Faker\Test\GeneratorTest::testGetFormatterReturnsCallable'.
.
Starting test 'Faker\Test\GeneratorTest::testGetFormatterReturnsCorrectFormatter'.
.
[...]
Starting test 'Faker\Test\Provider\ja_JP\PersonTest::testLastKanaNameReturnsNagisa'.
.

Time: 1.59 seconds, Memory: 23.75Mb
I may have used a bash command to check each test duration individually. It may work, except I would not have accurate data, as each test during less than a second would indicate “0 second”.
PHPUnit phing report
Then, I took a look for another solution and came on Christian Weiske’s post talking about the Phing phpunitreport task. Producing the same [Faker] (https://github.com/fzaninotto/Faker) report brought me the following page:

This display is of course truncated. But as you may have noticed, this output only displays raw numbers. Too difficult to interpret.
PHPUnit d3 report
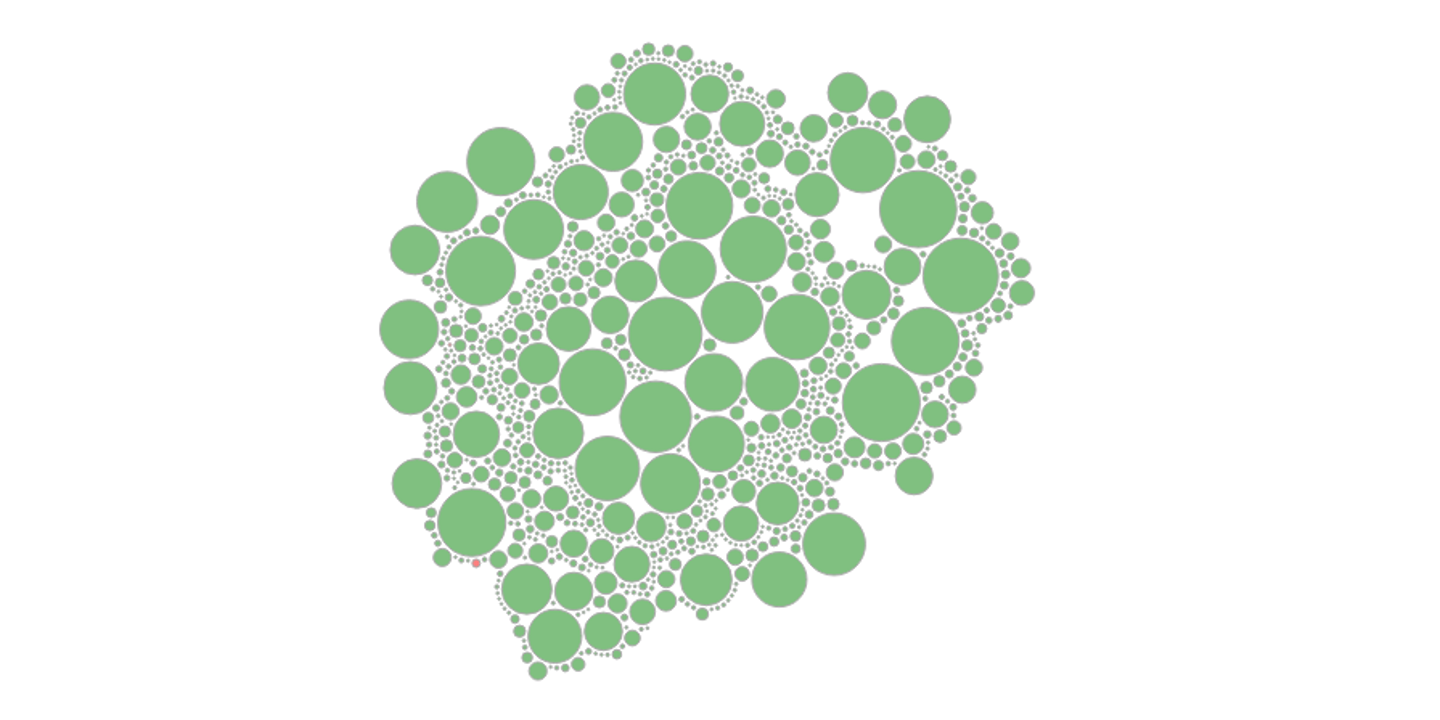
So, I got raw data on one side, and a great visualization library (d3.js) on the other one. Merging them leads to an easy-to-read visualization tool: PHPUnit d3 report, released under MIT license. Here is a Faker report generated by this tool:
The bigger a bubble is, the longer the test execution time is. Moreover, you can check in a single glance which tests are erred or are failing, thanks to the respective red and yellow colors. And if you hover the rebel bubbles, you will even get more details about the issue. Some fake tests were added to the report, to better see these special cases.
To create such a report, this tool has now its dedicated page. You simply have to generate an XML report from your PHPUnit test suite, using the phpunit --log-junit report.xml command, and copy/paste this report into the corresponding textarea to blow bubbles!
Embedding a report on your own site
More over, you can embed this chart into your own application or, as I did, on your project page. To do it, simply retrieve d3.js and the PHPUnit D3 report sources, and embed them on your page:
<div id="faker_report"></div>
<div class="tooltip" style="opacity: 0;"></div>

<link href="/labs/phpunit-bubbles/bubbles.css" rel="stylesheet" />
<script src="/labs/phpunit-bubbles/d3.min.js"></script>
<script src="/labs/phpunit-bubbles/d3.phpunitBubbles.js"></script>
Notice that for performance reasons, I did not embed the ReportTransformer. Indeed, as this page is purely static and as I only want to display Faker report, I can store directly the report in JSON format (you can retrieve it clicking on the Download JSON report link, just under the chart). So, once you get the data, simply write a few Javascript lines:
var chart = d3.chart.phpunitBubbles().padding(2);

d3.json("my-report.json", function(err, data) {
    d3.select("#faker_report")
        .datum(data)
        .call(chart);
});
You can of course customize colors or tooltip style with CSS. Yet, you can also interact directly with the chart parameters. For instance, you can change space between each bubbles changing the padding property. This is done really easily using the Mike Bostock’s re-usable chart design pattern with the following code:
d3.select("#faker_report")
    .padding(5)
    .datum(data)
    .call(chart);
We changed the padding here, but a wide range of parameters are configurable, such as chart dimensions or hovering events.